
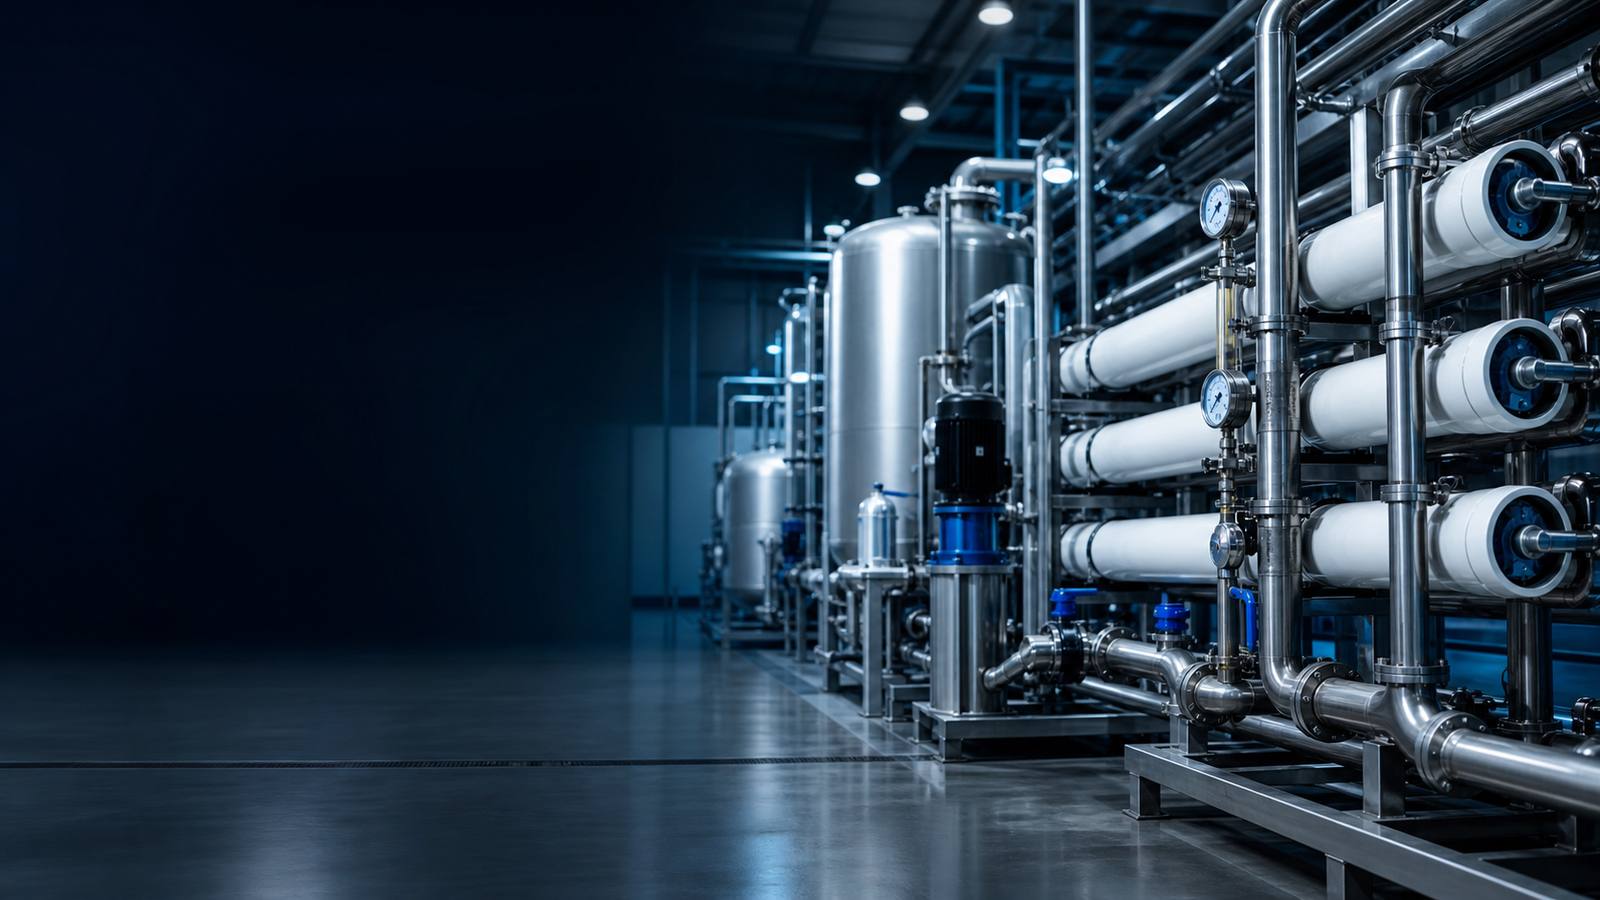
Water has an energy cost before it reaches a production line and often after it leaves. Pumps distribute it, treatment changes its quality, and heating or cooling changes its temperature. A decision that saves freshwater may add treatment energy, while a leaking hot-water line wastes both resources. Looking at the systems together helps compare improvements accurately. This guide gives industrial teams a method for creating that combined view, with explicit boundaries and measurements rather than a generic saving factor.
“Energy and water are deeply and fundamentally connected.”
International Energy Agency, Energy and Water
Map the route from source to final use
Draw sources, storage, treatment stages, users, reuse loops and discharge points. Mark pumps, blowers, heaters, chillers and associated equipment. Include shared equipment so its energy is not assigned twice. Note where water and electricity meters provide matching coverage and where estimates are necessary. Identify losses and unmeasured branches before calculating a headline indicator.
Choose one initial boundary, such as source pumping and treatment to a clean-water tank. This is easier to diagnose than a factory with incomplete submetering. Record the required output: volume, quality, pressure and schedule. An energy reduction that fails to deliver the required service is not improved efficiency. Keep service requirements visible during option selection and subsequent verification.
Use energy intensity with a consistent denominator
A useful indicator is electricity consumed divided by usable water delivered over the same period, in kilowatt-hours per cubic metre. Define usable water and exclude rejected or off-specification output where it cannot serve the intended purpose. Match dates and explain whether electricity includes pumping, treatment or both. Differently bounded ratios can produce misleading comparisons.
Review the ratio alongside total energy, water and operating hours. Low utilisation can increase intensity because fixed loads remain active. Production changes, source quality and pump head also affect trends. An increase should prompt investigation before a conclusion about equipment condition. Keep the raw numerator and denominator so another engineer can interpret the result and reproduce the monthly report.
Examine pumping duty before adding solar
Pumping energy depends on flow, head and overall efficiency. Total dynamic head includes elevation, required delivery pressure and friction. A poorly matched pump may consume more electricity than necessary for its service. Review the curve, duty point, pipework and controls with a qualified engineer before modifications. A nameplate power rating alone does not establish operating energy.
A planning check is daily electricity in kilowatt-hours approximately equal to 0.002725 times volume in cubic metres times head in metres, divided by combined efficiency. This physical relationship uses water density, gravity and unit conversion. It does not replace pump selection or capture every operating effect. Solar sizing then requires local resource data, losses, operating windows and dependable backup or storage.
Account for the energy consequences of quality
Treatment must match the required use. Excess treatment can add energy, chemicals, reject and maintenance. Insufficient treatment can damage equipment or compromise the product. Define acceptance criteria first, then compare options using representative analyses and seasonal variation. A single sample may not describe the year. Record the use and quality boundary for each proposed reuse stream.
Compare usable output rather than feed capacity. For membranes, include feed, permeate, reject and the energy boundary used in recovery calculations. For biological treatment, retain aeration, mixing and duties needed for approved performance. Do not reduce a critical process simply because its meter is prominent. Proposals must respect the designer’s operating envelope and applicable quality requirements.
Look closely at heating and cooling
Reducing avoidable heated-water loss can save replacement water and heating energy. Record the temperature difference and service requirement before estimating benefit. Insulation, heat recovery and maintenance may be relevant, but the intervention depends on the process. Keep heat energy separate from electricity unless a stated conversion is used, and account for the equipment efficiency when estimating purchased energy.
Cooling creates another interaction. Controlling scale can support heat transfer, while changing cooling technology can shift water and electricity requirements. Assess the complete service, local conditions and operating profile. Evaluate the effect on both resources. Document the trade-off so management can compare alternatives against source availability, cost and operational requirements rather than selecting solely on one reduced utility bill.
Value projects without counting benefits twice
Include electricity, freshwater, chemicals, testing, disposal, maintenance and replacement in the cost table. Identify variable costs actually avoided. Lower water volume may not remove a fixed charge. Solar can displace purchased electricity while still requiring grid support and maintenance. Use current bills and quotations, and label assumptions whose values could materially change the decision.
When projects interact, establish sequence. If pump efficiency improves first, assess solar against the reduced load. Adding both original saving estimates overstates their combined benefit. Compare each option with one baseline and show residual consumption. Include commissioning and verification in the budget. This is more useful than comparing isolated supplier paybacks calculated with different utilisation, tariff or maintenance assumptions.
Create an operating improvement plan
Start with a measured baseline and short action list. Identify the mechanism, owner, cost, implementation window and evidence required. Include production availability, safe isolation and quality testing. Prioritise repairs where evidence supports them, then assess larger equipment or renewable-energy investments against remaining demand. Record the dependency between projects so later teams understand why the selected system was sized that way.
After implementation, compare under similar conditions or explain adjustments. Track unintended effects such as lower pressure, longer runtime or changing reject volume. Keep a review date in the maintenance calendar. A combined programme works when utilities, production and sustainability share one record and can explain why numbers changed. Update it after source, equipment or production changes.
Questions for your next review
At the next utility meeting, select one pumping or treatment loop and examine both its water and electricity records. Agree the useful service delivered, such as treated water meeting a specified requirement, before choosing an efficiency indicator. Compare records from the same operating period and note variations in production, head, influent quality and equipment availability. Ask which proposed improvement reduces demand and which merely changes the energy source. The distinction matters because a solar installation can supply electricity without correcting avoidable water losses. Allocate actions across operations, maintenance, procurement and finance so each assumption has an owner. Close the review by specifying the measurement needed after implementation. Without that verification plan, even a technically plausible improvement remains an estimate rather than demonstrated operating performance.
Key takeaways
- Map water routes and energy loads.
- Compare matching kWh and water boundaries.
- Improve duty and efficiency before solar sizing.
- Use one baseline for combined projects.
Free tools for this topic
Sources and further reading
Calculation examples are illustrative planning calculations, not reported project results. Confirm current Indian and site-specific requirements before applying international guidance.