
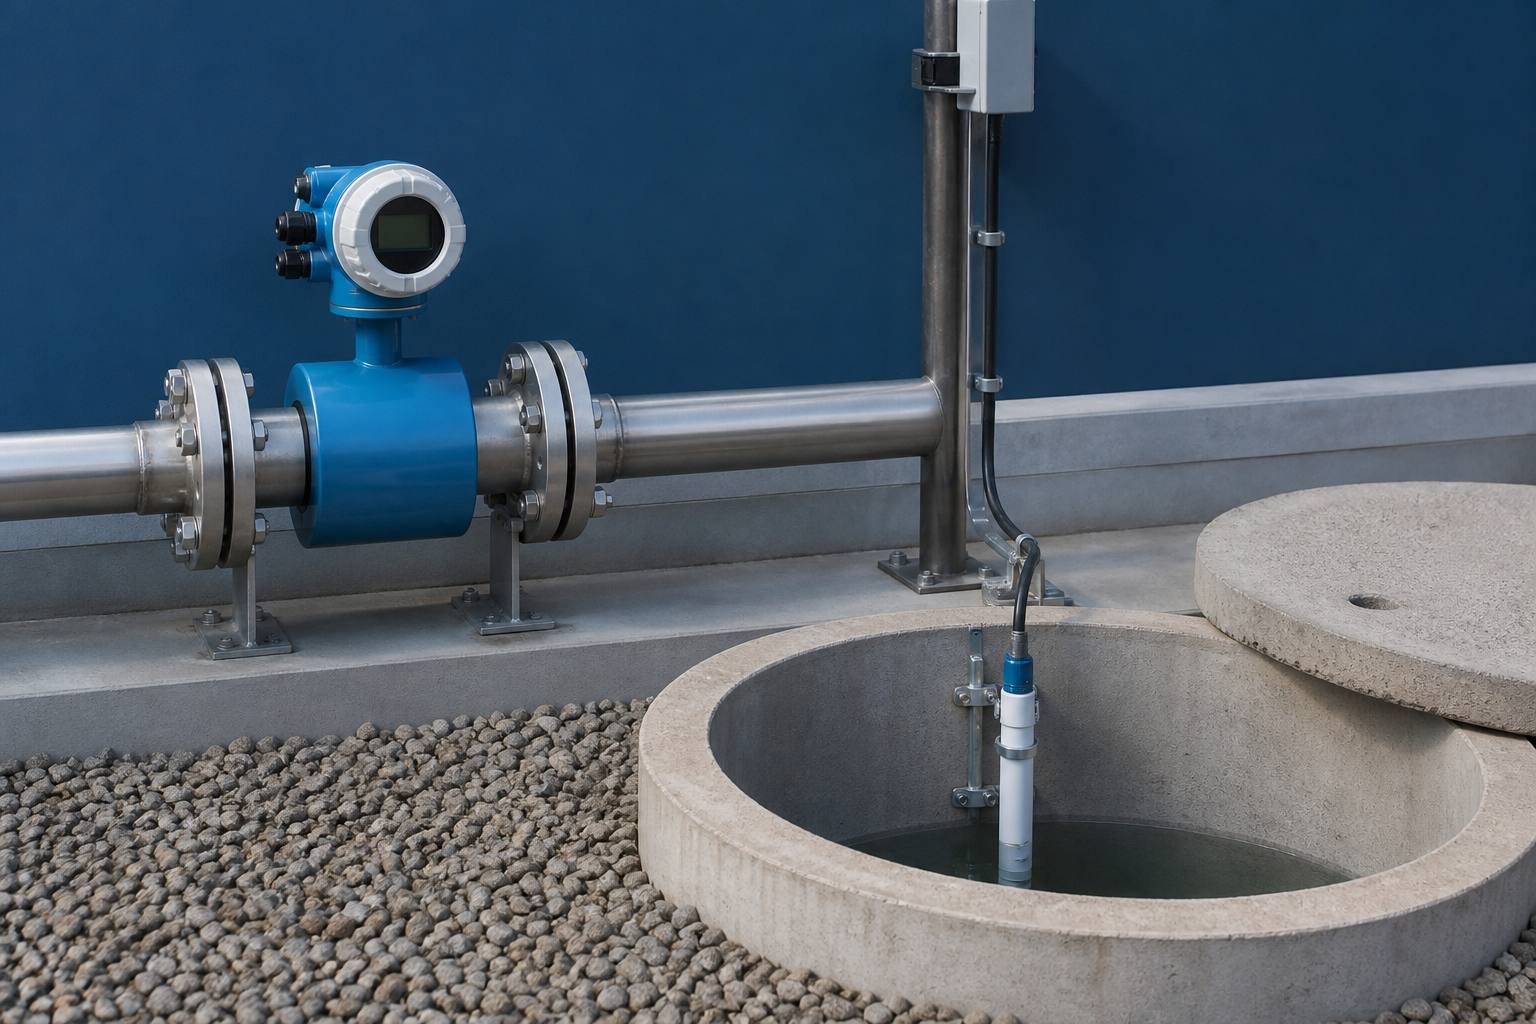
Digital water monitoring becomes useful when it helps someone decide what to do. A factory may have several functioning meters yet still be unable to explain rising groundwater abstraction or falling treatment recovery. The missing connection is often between the instrument, the data record and the person responsible for responding. This guide provides a starting point for facilities planning meters, telemetry or a dashboard. Begin with the questions operations needs answered, then specify the measurements, communications and review process required to answer them.
“To reduce unnecessary water loss, all detected leaks should be repaired quickly.”
U.S. EPA, WaterSense at Work
Define decisions before selecting a dashboard
Write down the decisions that lack reliable evidence. Examples include whether treatment meets its recovery target, whether a tank overflows at night, or whether a borewell meter agrees with operating records. Each question needs a boundary, useful frequency and response owner. A monthly sustainability report and an immediate overflow alarm have different data requirements.
Create a register containing asset name, location, unit, signal type, reading frequency, installation date and calibration record. Specify whether the value is a cumulative total, instantaneous rate or calculated average. This distinction prevents adding flow rates as if they were measured volumes. Agree which record is authoritative when a manual log and the dashboard disagree, and establish how discrepancies will be investigated.
Place meters where they explain the balance
Start at the source boundary: groundwater, municipal supply, tankers and other incoming water. Identify major uses and where wastewater enters treatment, treated water leaves, water is reused and discharge exits. A facility diagram should show which branch each meter covers. Submetering is useful when it separates a material use or suspected loss that the main meter cannot explain.
Avoid adding every reading into one total. Recycled water may cross internal meters several times without being a new withdrawal. Define inventory changes separately. Document unmetered branches and estimation methods. If the balance does not reconcile, show the gap as unexplained. Automatically distributing it across departments makes a dashboard look complete while hiding the problem the team needs to investigate.
Specify instruments and installation together
A meter must suit the pipe, flow range, fluid properties, installation conditions and required accuracy. Ask the supplier to review straight-run requirements, full-pipe conditions, grounding where applicable, access and protection from flooding or damage. A suitable instrument installed incorrectly can produce precise-looking but unreliable readings. Keep installation drawings and commissioning checks with its record.
For tank levels and groundwater measurements, document the reference datum and operating condition. A groundwater reading during pumping cannot simply be compared with a rested level as if both represented the same condition. Record calibration, servicing and replacement events in the history. These events help explain step changes and prevent a replacement instrument’s reset total from appearing as negative consumption.
Choose a practical sampling and communication plan
Set the interval around the decision. Changing pump operation may need finer readings than a management trend report. Consider coverage, power reliability, buffering during communication loss and transfer costs. Clarify whether a missing transmission means equipment stopped or the connection failed. Retain timestamps and distinguish delayed readings from current ones.
Ask for a usable export format and clear data ownership. Procurement should include retention, support, alarm delivery and the ability to change providers without losing history. Coordinate permissions and remote connections with IT. Protect operational controls, especially when a system can actuate valves or pumps. Begin with monitoring where remote control is unnecessary, and document responsibility for software updates and access reviews.
Make data quality visible
Use separate flags for missing readings, out-of-range values, resets and estimates. Preserve original readings when corrections are made. Record who changed a value, why and the replacement method. A monthly figure should be traceable rather than silently reconstructed from an average day. Otherwise, a communications problem can become an apparently reliable consumption trend.
Reconcile interval consumption with cumulative differences and invoices over matching dates. Check units: litres and cubic metres differ by one thousand. Distinguish measurement time from server receipt time and agree one time zone for reports. These controls determine whether engineers, finance and sustainability teams can use the same numbers confidently. Record known uncertainty when measurement coverage remains incomplete.
Use alarms that someone can act on
Start with conditions that have a clear response: continuous flow during a shutdown, rapid tank-level loss, a stuck makeup valve or treatment output outside its approved range. Establish a baseline before thresholds. Night-time flow that is abnormal in an office could be normal in a continuously running process. Include operating schedules in the interpretation.
Specify the recipient, response and escalation for each alarm. Review nuisance alarms and unresolved repeats. Record whether a fault was confirmed, what was repaired and whether the measurement returned to its expected pattern. An alert is an investigation trigger, not proof of a leak. Verify it against operations before shutting equipment down or making a public claim about saved water.
Measure success through operating improvements
Review freshwater use per unit of production, treatment recovery, reuse, data completeness and time to close a confirmed fault. Show absolute consumption alongside intensity, because production changes can move them in different directions. Define the reporting period and denominators once. Compare like-for-like shifts or explain changes in the product mix.
Pilot one bounded system, then improve the specification before extending it. Compare the cost of instruments, installation, communications, maintenance and staff review with the decisions enabled. Document verified results separately from estimated avoided losses. A useful programme leaves clearer ownership and faster diagnosis, as well as a dashboard. Review the meter map whenever pipework or production changes, and include instrument maintenance in the routine site plan.
Questions for your next review
A useful procurement exercise is to walk through a single abnormal event with the proposed supplier. Ask what happens if a tank overflows after office hours, the network disconnects, or a cumulative meter resets. Identify the retained local record, the person who receives the alert and the acknowledgement expected. Confirm how readings are exported if the service contract ends, and who owns the historical data. Request a documented test using known readings before accepting the installation. Include timezone, units, clock synchronisation, battery replacement and access permissions in that test. These operational details belong in the scope of work, not in an informal promise to configure them later. A dashboard is ready for handover when users can explain and act on its numbers.
Key takeaways
- Start with decisions and a meter map.
- Keep reuse separate from new withdrawals.
- Expose missing and estimated data.
- Assign a response owner to every alarm.
Free tools for this topic
Sources and further reading
Calculation examples are illustrative planning calculations, not reported project results. Confirm current Indian and site-specific requirements before applying international guidance.